Presenting Your Findings

Module three

Reporting your company’s carbon footprint data can sometimes be a bit dry. Lists of stats, numerical tables and spreadsheets have their place, but when you’re presenting your findings to stakeholders on your website or in your annual report there are loads of ways to keep the content engaging, clear and dynamic

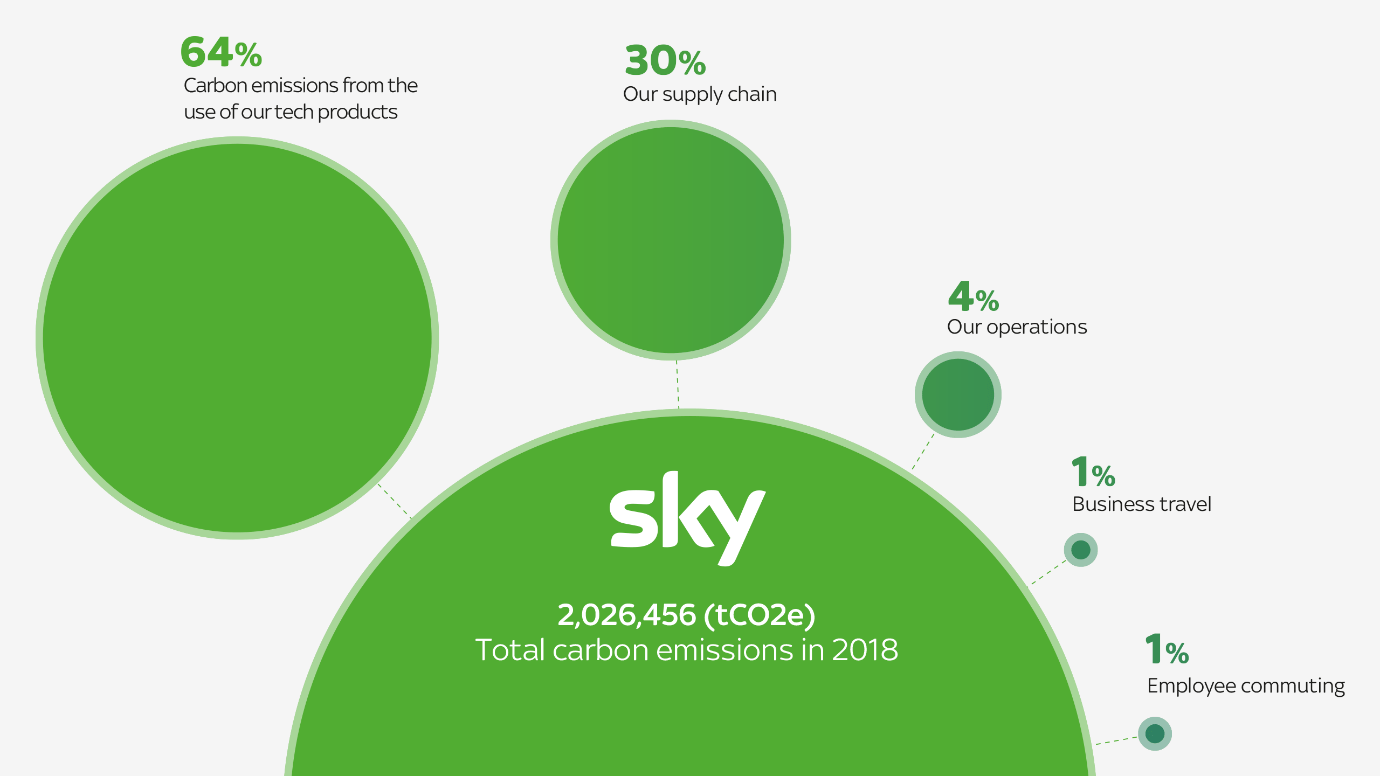
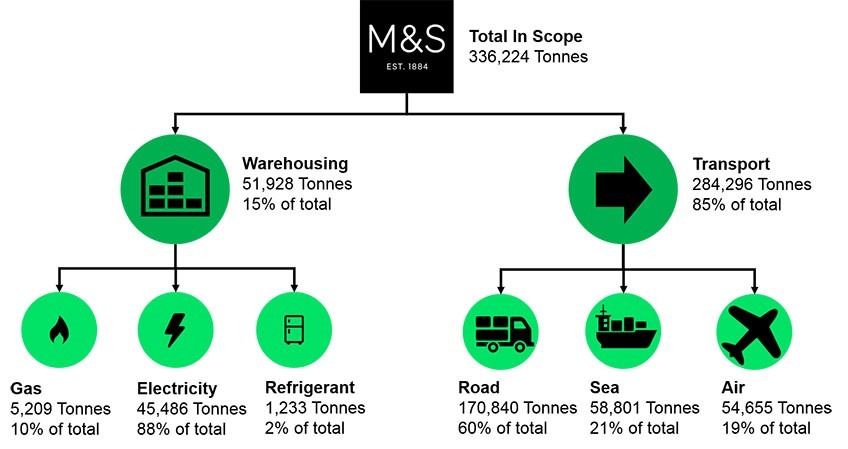
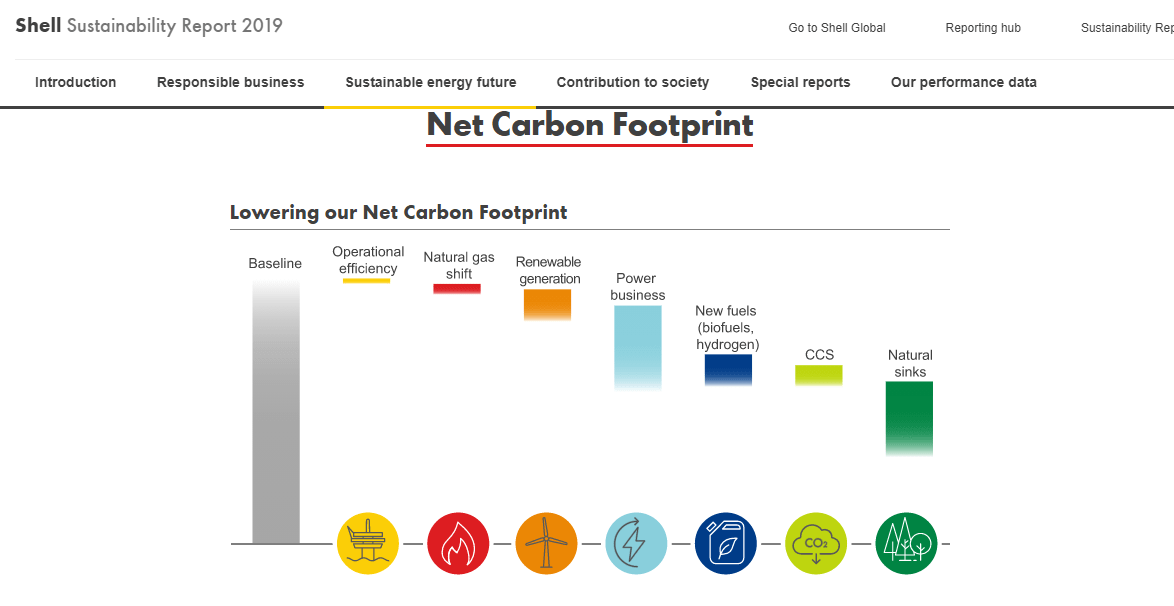
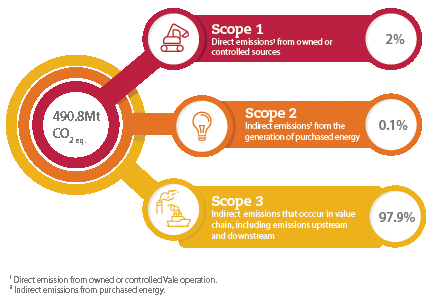
You can take inspiration from some of the businesses we’re sharing in this resource. They’ve used colourful graphics, bold headings and clear stats to communicate their current emissions and future plans – and you can do something similar!

Just remember to be transparent to avoid any confusion and unintentional greenwashing. Detail exactly what elements contribute to your published carbon footprint, and if you haven’t managed to measure some material elements yet, make sure to say you’re working on it.

Sky

Sky has published this really interactive and clear report on their carbon emissions and steps they’re taking to reduce it and educate others.

Marks & Spencer

Marks & Spencer’s blog shows their journey to carbon reduction.

Shell

Vale

Conoco Philips

Conoco Philips shows its GHG emissions.

BNP Paribas

JP Morgan Chase

JP Morgan Chase details its emissions by Scope, and the ways it’ll work to reduce them.

BDO

BDO looks at its carbon emissions by source and then breaks it down into granular detail.

Sustainable Travel

A Heart of the City alumnus

A Heart of the City alumnus shared its carbon footprint presentation with us. It doesn’t always have to be fancy, it just needs to get the message and data across.

This was last updated in October 2021 by Heart of the City. We’ve created these resources for individual SMEs to use. None of our content is to be adapted, reused or repurposed for commercial use.

Climate for SMEs: 4 Steps to Action is funded by the City of London Corporation in support of its Climate Action Strategy targets for a net zero and resilient Square Mile.

DOWNLOAD THIS RESOURCE